- Home
- Air Quality
- Air Quality Data
- Data Summary
Data Summary
Air Quality Data Summary for 2024
Fine particles and smog (ozone) are our greatest concerns in Puget Sound. These types of air pollution cause heart attacks, strokes, and even premature death. Air pollution is especially dangerous for children, the elderly, and people with lung or heart diseases.
The table below shows the air quality health categories for 2024 by county. Overall, most days were categorized as GOOD air quality. However, there was also a significant number of MODERATE days, with King, Pierce, and Snohomish counties each experiencing about 28% of days in the MODERATE category. In 2024, the US Environmental Protection Agency updated the thresholds for the health-based air quality index, which has led to more days being classified as MODERATE, even though the overall air quality has not worsened compared to recent years.
King County also observed 4 days in the UNHEALTHY FOR SENSITIVE GROUPS category due to high ozone levels at one of our monitoring sites in Enumclaw. Pierce County experienced 1 day in the UNHEALTHY category, primarily due to fireworks on July 4th. Since 2015, our region has experienced unprecedented wildfire smoke, resulting in the highest fine particle levels we've recorded since monitoring began in 1980. Fortunately, in 2024, our region was not impacted by wildfire smoke.
2024 Air Quality, Days by Health Category
| County | Good | Moderate | Unhealthy for Sensitive Group | Unhealthy | Very Unhealthy | Hazardous |
| King | 257 days | 105 days | 4 days | 0 days | 0 day | 0 days |
| Kitsap | 356 days | 10 days | 0 days | 0 days | 0 days | 0 days |
| Pierce | 266 days | 99 days | 0 days | 1 day | 0 days | 0 days |
| Snohomish | 261 days | 105 days | 0 days | 0 day | 0 days | 0 days |
Fine particles
Fine particles are tiny, microscopic pieces of pollution which are even smaller than the width of a hair. These can easily enter the deepest part of your lungs and cause breathing and heart problems. In our region, they mainly come from wood smoke (from home heating), vehicles, wildfires, and industry.
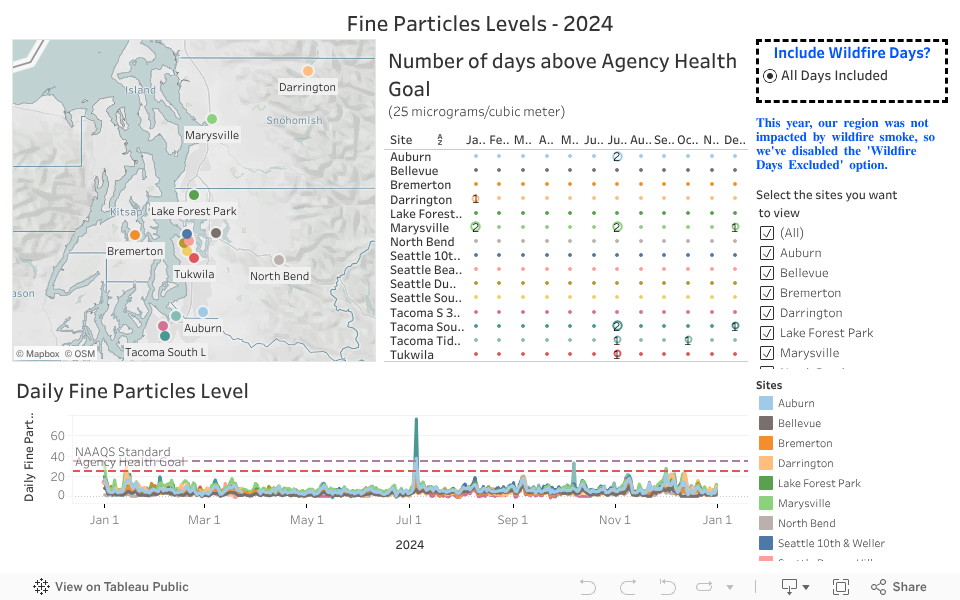
The graph below shows daily fine particle levels at all the air monitoring sites for 2024. It highlights that, for most of the year, fine particle levels at all sites remained within the EPA's standard of 35 micrograms per cubic meter. The only exceptions were two days—July 4th and 5th—due to fireworks. This year, our region was not impacted by wildfire smoke, so we disabled the Wildfire Days Excluded option in the graph below. As a reminder, wildfire smoke is considered an “exceptional event” by EPA and these values are excluded from any required regulatory action.
Studies have also shown that even levels below the EPA standard can have significant health impacts. To address this, the Agency has a health goal of 25 micrograms per cubic meter. This health goal was exceeded for 2 days in July due to fireworks and up to 4 days during the winter months because of wood smoke from home heating.
Black Carbon
Fine particles that come specifically from diesel exhaust is our greatest concern as they carry the most health risks, but we can’t directly measure them and there is no EPA standard for them. Although not a perfect measurement, we use a “black carbon” monitor to estimate our impacts from diesel pollution. Diesel exhaust represents over 80% of the potential cancer risk from air pollution in the Puget Sound area. Most of the diesel exhaust in the Puget Sound region comes from four transportation sectors: maritime, off-road equipment, on-road vehicles, and rail.
The graph below shows that black carbon levels have been decreasing since 2002. The levels have remained low in summer and higher in the winter when the air is typically more stagnant. This year, the levels were highest during the wood smoke impacted days in the winter months. In more recent years, levels appear to be either flattening or reducing more slowly.

Ozone (also called “smog”)
Unlike fine particles and black carbon, ozone (smog) is created on hot summer days by chemical reactions with different types of air pollution from vehicles, industry, paints, solvents, and gasoline fumes.
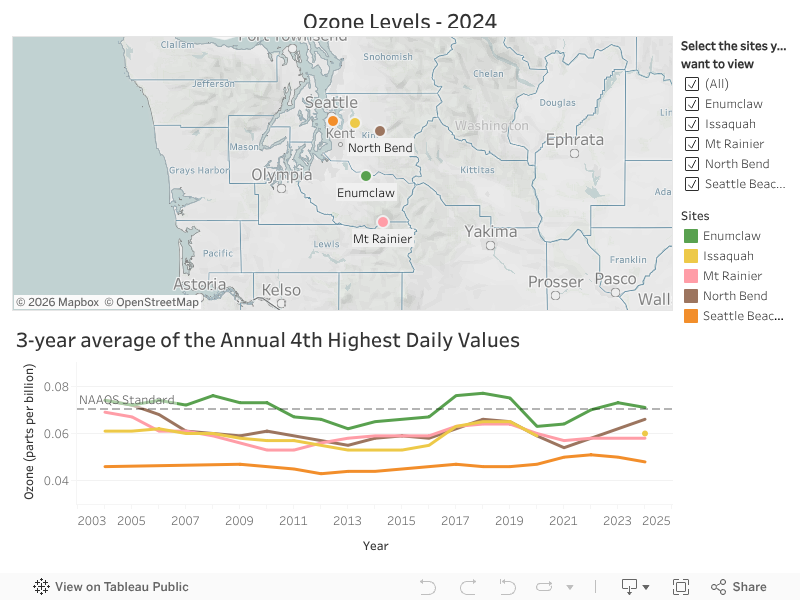
In 2024, ozone levels at the Enumclaw site were lower compared to previous years. However, the EPA standard is based on a three-year average, and the 2022-2024 average (shown in the graph below) exceeded the standard due to high ozone levels and wildfire smoke during the summers of 2022 and 2023. Ozone levels at the other sites remained below the standard. Currently, our region is not designated as nonattainment for ozone, as the EPA is not in a standard review year (which occurs every five years). Their next review is expected within the next couple of years.
National and local air pollution reduction programs
Nationally, large reductions in diesel exhaust are expected to continue, thanks to the newer diesel fuel and truck engine standards that took effect in 2007. The newer trucks are 50 to 60 times cleaner than the older, dirtier trucks. In 2011, an international agreement required incoming ships to use the cleanest shipping fuels along US coastlines (called an Emission Control Area) which also reduces diesel exhaust in our area. EPA continues to develop rules to reduce air toxics emitted from large and small industrial sources, which we ensure are implemented by the industries in our four counties through our compliance program.
Washington State adopted large sweeping climate actions which will help in reducing the emissions in our four-county region in 2023. These actions include a new low carbon fuel standard, a cap-and-invest program, the WA Clean Energy Transformation Act, a future ban on new internal combustion engines by 2035, and many more.
Our Agency has also been working to further reduce air pollution on a local scale. With our Diesel Solutions program, we partner with private and government organizations to reduce diesel exhaust. Through our wood stove replacement program, and continuing to ensure wood heating burn ban compliance, we’ve seen levels of wood smoke come down in our region over the years. We continue to pursue other opportunities to lower air pollution in the region, including greenhouse gas reductions.
View the detailed 2024 Data Summary.